
In quality management, there are two important concepts called common cause variation and special cause variation (1). Common cause variation is the natural variation in a process, as viewed from its current state. Special cause variation means variation, that is unusual for the process. The term Assignable Cause is also used to describe this sort of phenomenon as there is a special, assignable cause causing the variation.
Common cause variation vs special cause variation
Imagine a simple process consisting of throwing two dice and then adding the results. Most of the values will land close to seven while sometimes you will get more extreme values such as two or twelve. The variation is natural for the process. However, if someone would throw a third die, the process would experience special cause variation. In special cause variation, the process is experiencing a disturbance that is not within the normal variation. The simplest way to notice special cause variation is to utilize control charts and identify outliers. An example of this is presented in the figure below. The red line is an upper control limit, which is calculated based on the first twenty values, and values above it indicate an outlier.
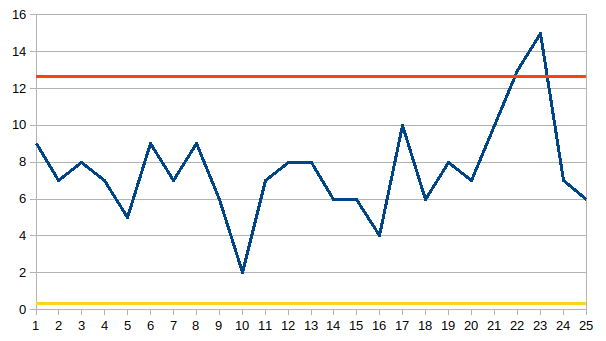
According to the control chart, there has been a change in the underlying process, which warrants investigation. The process change already occurred at timestep 21, but at 22 the process crossed the control chart limit. While this is a simplified example, it highlights how special cause variation can be spotted.
To improve processes, it is crucial to separate common cause variation from special cause variation. When special cause variation occurs, there is an unusual behaviour in the process and eliminating the cause of the variation is usually a time-constrained task. Identifying and eliminating the root cause removes the additional variation from the process. On the other hand, as common cause variation is part of the random noise in the process, managing common cause variation leads to overall reduced variability.
Traditional outlier detection in the process industry
Traditionally, the process industry utilizes DCS-systems for outlier detection, where a user has defined minimum and maximum thresholds for tags/measurements in the system. The system is able to compare tag values against threshold values during operations and sets off an alarm if a tag value is above or below its threshold. The systems might utilize other outlier detection methods (such as standard deviations or Z-scores) as well, but the principle is the same: an extreme value sounds an alarm.
When outlier detection fails
There are two kinds of mistakes that can be made when it comes to outlier detection: too frequent alarms (an alarm going off when the process is running as it should be, a false positive), or alarms going off too rarely (not sounding the alarm when the process is not running correctly, a false negative). Many plants are sadly riddled with too frequent alarms. As the DCS-system keeps pinging alarms frequently, personnel begin to disregard them as they become used to almost all of them being false positives. On the other hand, not having any alarms is also problematic as it is unlikely that a process is stable all the time. The system might contain tens of thousands of tags that monitor the process, so it is nearly impossible to locate problem areas without any help.
Additionally, outlier detection can only analyse a single tag at a time. While it is technically possible to create rules that consider multiple tags, it is not possible to create them for a vast number of tags using traditional systems. Thousands of tags become a million interactions if all interactions are considered (One thousand tags * all other 999 tags).
For instance, consider a simple system, that consists of an inflow, an outflow, as well as a filter between these flows. During normal operations, the outflow will be a specific percentage of the inflow. If the filter starts to generate a blockage, this percentage will decrease. The automation system will simply increase the inflow if there are no production issues. The inflow might have a broad range of values that are still considered normal operation and are well within the outlier limits. All seems to be going on well according to the DCS-system, even though a blockage is occurring. Neither the inflow nor the outflow alone will highlight this problem. Thus, it is necessary to analyse the values in relation to one another to understand the problem.
How Factory Harmonizer can aid in noticing special cause variation
Factory Harmonizer is an AI-based software solution designed for operators and engineers. Factory Harmonizer brings together the best of human expertise, machinery, and automated machine learning to stabilize the production process for better productivity. One of the many functionalities of Factory Harmonizer consists of detecting special cause variation, especially when it comes to interactions between process parameters.
As Factory Harmonizer automatically constructs a significant number of models (usually we see a model for 50% of the measurements), these models can highlight issues concerning interactions quickly. When harmony values (harmony value is the estimated value for the tag based on other measurements) start to differ significantly from the measured value, it indicates issues in the underlying process. The process is experiencing special cause variation which warrants further investigations.
In a case example, this situation occurred with a pump. The measured value and the harmony value started to deviate from each other. The pump was operating at a higher-than-expected level. However, the small deviation was still in the normal operating range for the pump, so no alarms were raised. The actual power of the motor and the harmony value for the power is presented below.
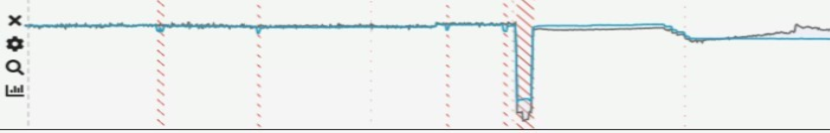
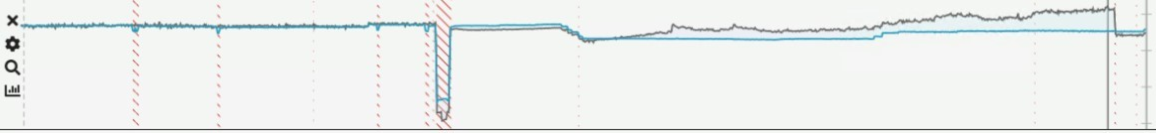
There is a clear deviation between the actual value and the harmony value compared to the history. This indicates that there is an issue in the process. The operators were quick to realize a filter was getting clogged. The phenomenon occurred a couple of times a year at the plant. As the system was a redundant system, and cleaning the filter would cause a production stoppage, the operators decided to leave the filter alone. However, as the filter was getting more clogged, the pump had to work even harder to compensate. This was easily visible through Factory Harmonizer as shown in the figure below.
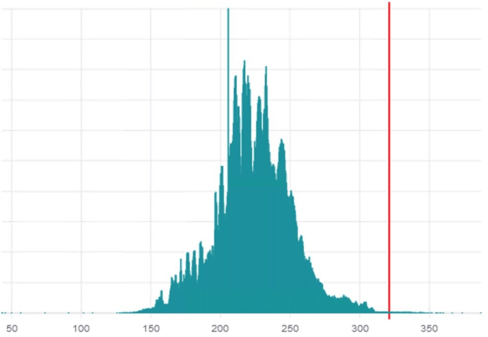
Only after multiple days, the value starts to reach its outlier level. This is shown in the figure below. By this time, Factory Harmonizer had identified and brought light to the issue for four days. Despite this, the operators waited for a good time window to clean the filter up as it would interrupt the production. When cleared, the disharmony was immediately resolved. Without Factory Harmonizer the issue would have been raised much later, likely just hours before the clean-up occurred.
Elevate your process monitoring with Factory Harmonizer
Handling common cause variation and noticing special cause variation are crucial tasks for every plant. The earlier you notice special cause variation, the easier it is to fix the issue before it becomes an actual production problem. If too many issues go unnoticed in your process before they become actual problems, you should consider giving Factory Harmonizer a try.
Want to hear more about how we at SimAnalytics help factories improve their productivity?
Book a call with one of our experts.
Footnotes
- Breyfogle III, Forrest W. (2003) Implementing Six Sigma: Smarter Solutions Using Statistical Methods, John Wiley & Sons; 2nd edition